Scaling GEO Images in QGIS
Learn how to visualize Capella GEO products in QGIS using dB scaling and histogram adjustments to enhance SAR backscatter features.
Capella GEO data products contain the radiometrically calibrated intensity in linear scale. The pixel value contains calibrated amplitude information, Sigma Nought (𝜎0), and are stored as a 16-bit raster GeoTIFF. When opened in QGIS, these images will display the full dynamic range of pixel values, meaning they will sometimes appear very dark when initially opened. Many times, the image data of interest will be clustered around lower values within the dataset.
To help in viewing these specific pixel values of interest within a scene, users will need to scale the image in some fashion. There are many methods of scaling an image, though a common way is to scale and view the data in dB, which is a type of logarithmic stretch. Sometimes, additional scaling may be applied after converting to dB to help pull out certain features within the image. Instructions on scaling images are below.
Steps to Scale a SAR image to dB
- Open the GEO data product in QGIS. The image will appear dark as it is scaled to the full dynamic range.
- Select Raster from the top menu, and choose the Raster Calculator option from the menu.
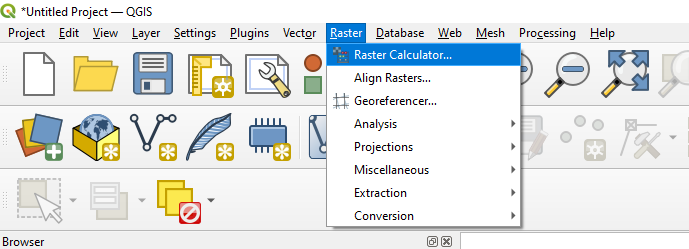
- Enter the following expression into the calculator:

where SC represents the value in the scale_factor field of the extended metadata and DNgeo represents the dataset. The scale factor will appear as such: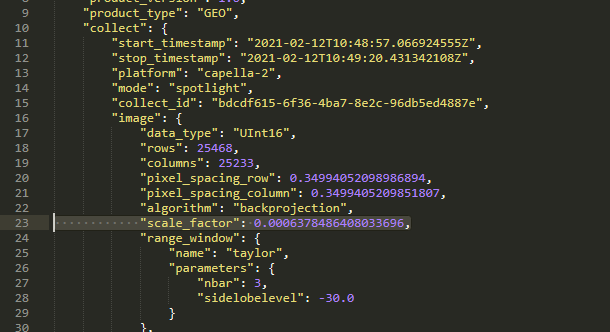
An example of the steps can be seen below. It is recommended to maintain the original name of the dataset, though add the suffix _dB to the end to note the scaling of the image you are computing.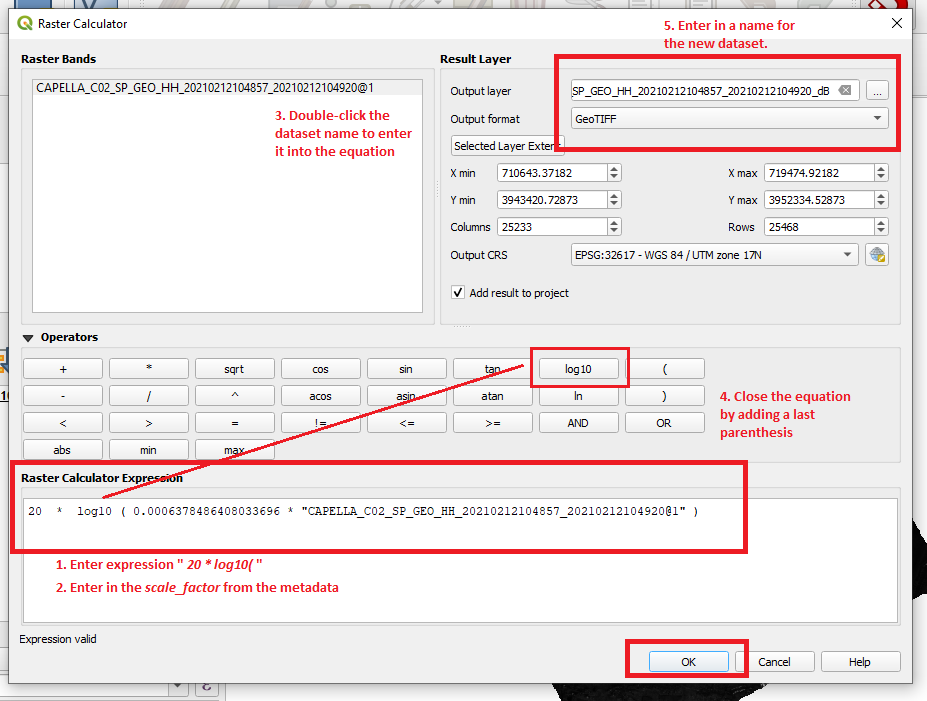
- Click OK to compute the new layer.
- Once computed, open the new layer in the layer in QGIS. It may open automatically if Add Result to Project is selected upon scaling the image in Raster Calculator.
If you desire, the data can still be scaled further to highlight areas of high or low backscatter intensity values by manipulating the histogram of the image.
- Right-click on the layer and select Properties.
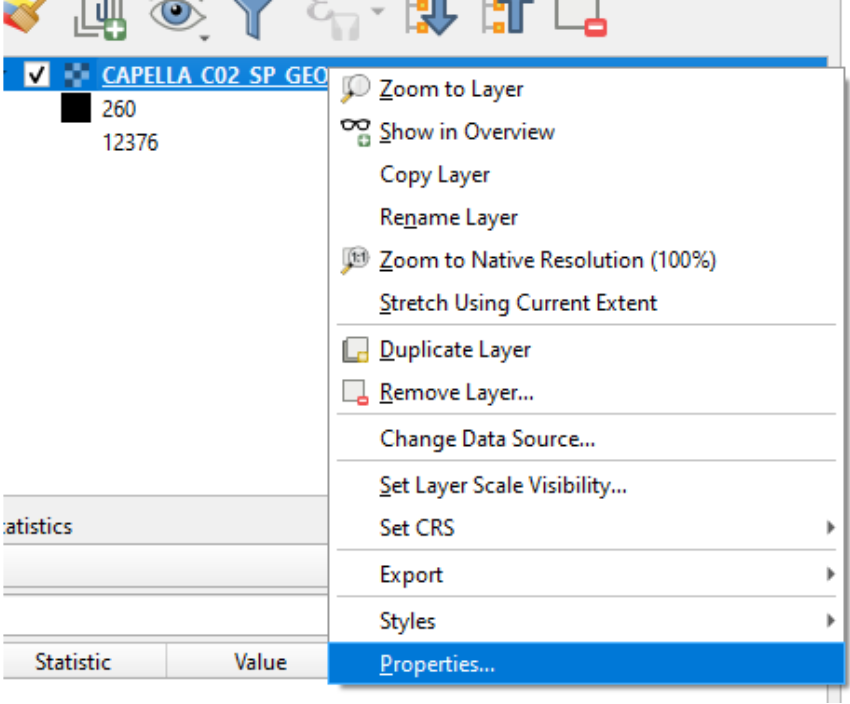
- Navigate to the Histogram section of Layer Properties.
- Next Compute a histogram from the new raster layer.
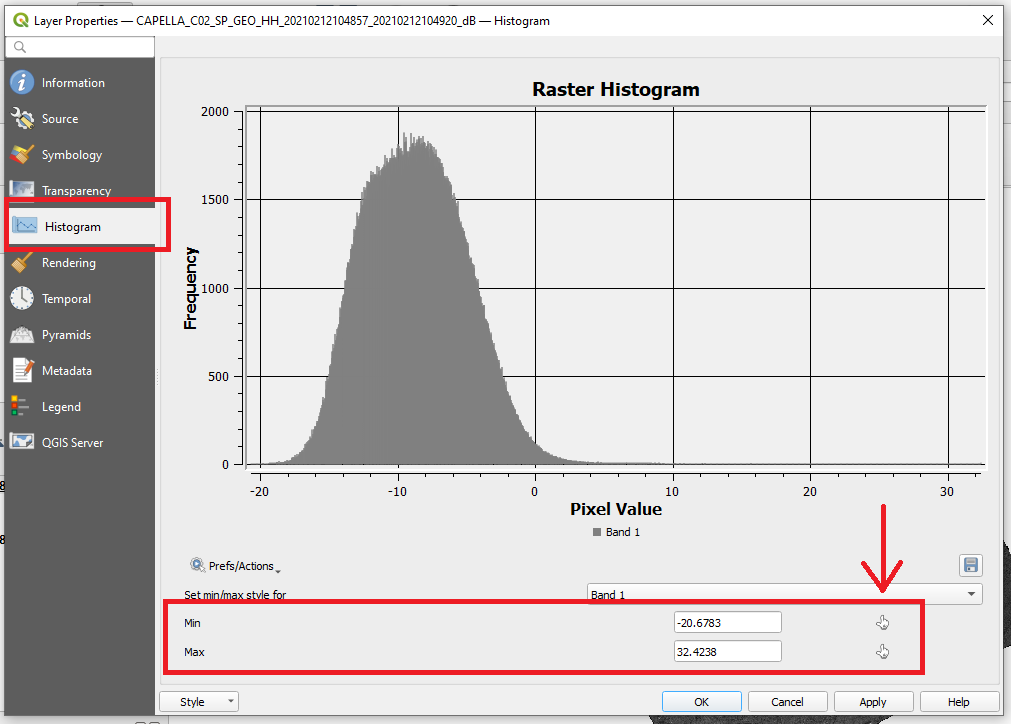
- Then cluster the pixels around the upper and lower bounds of the histogram’s data to alter the contrast between the light and dark pixels.
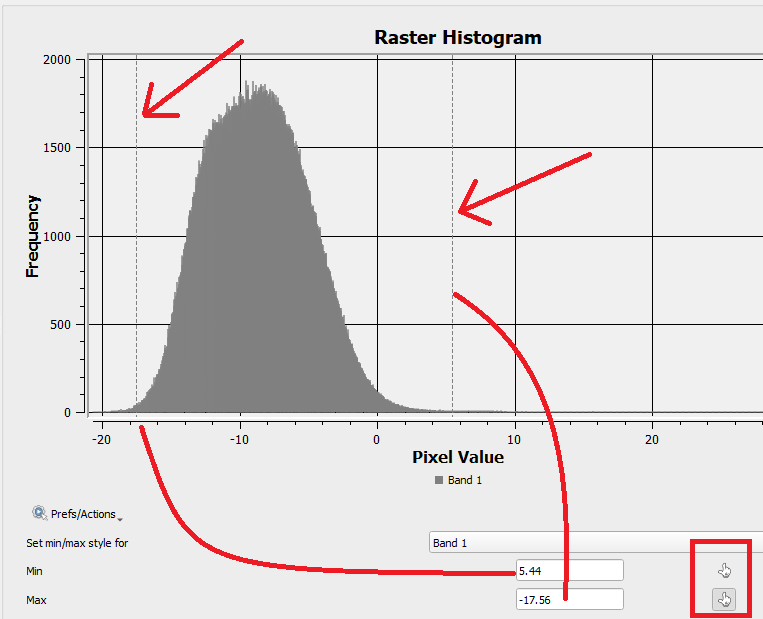
- Click Apply and the dB image will now be linearly-scaled beyond the log-scaling performed. The min/max values can be altered to bring out different clusters of backscatter intensity.