Analytic results are displayed on the AOI Details page with the most recent results selected by default. The following screenshot shows how instances of the analytic results appear on the timeline. 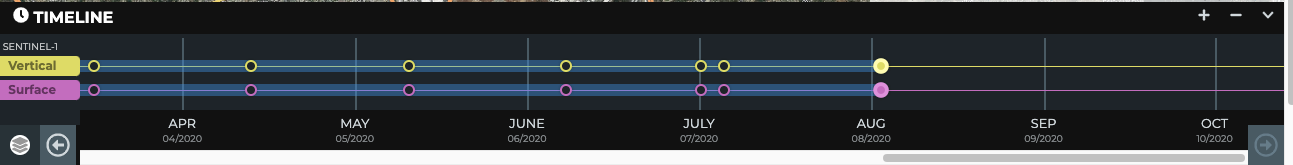
Analytic results may be switched to different time periods by clicking the dots along the timeline.
The timeline works in conjunction with the Layers Control at the top right. As layers are turned on they appear in the timeline.
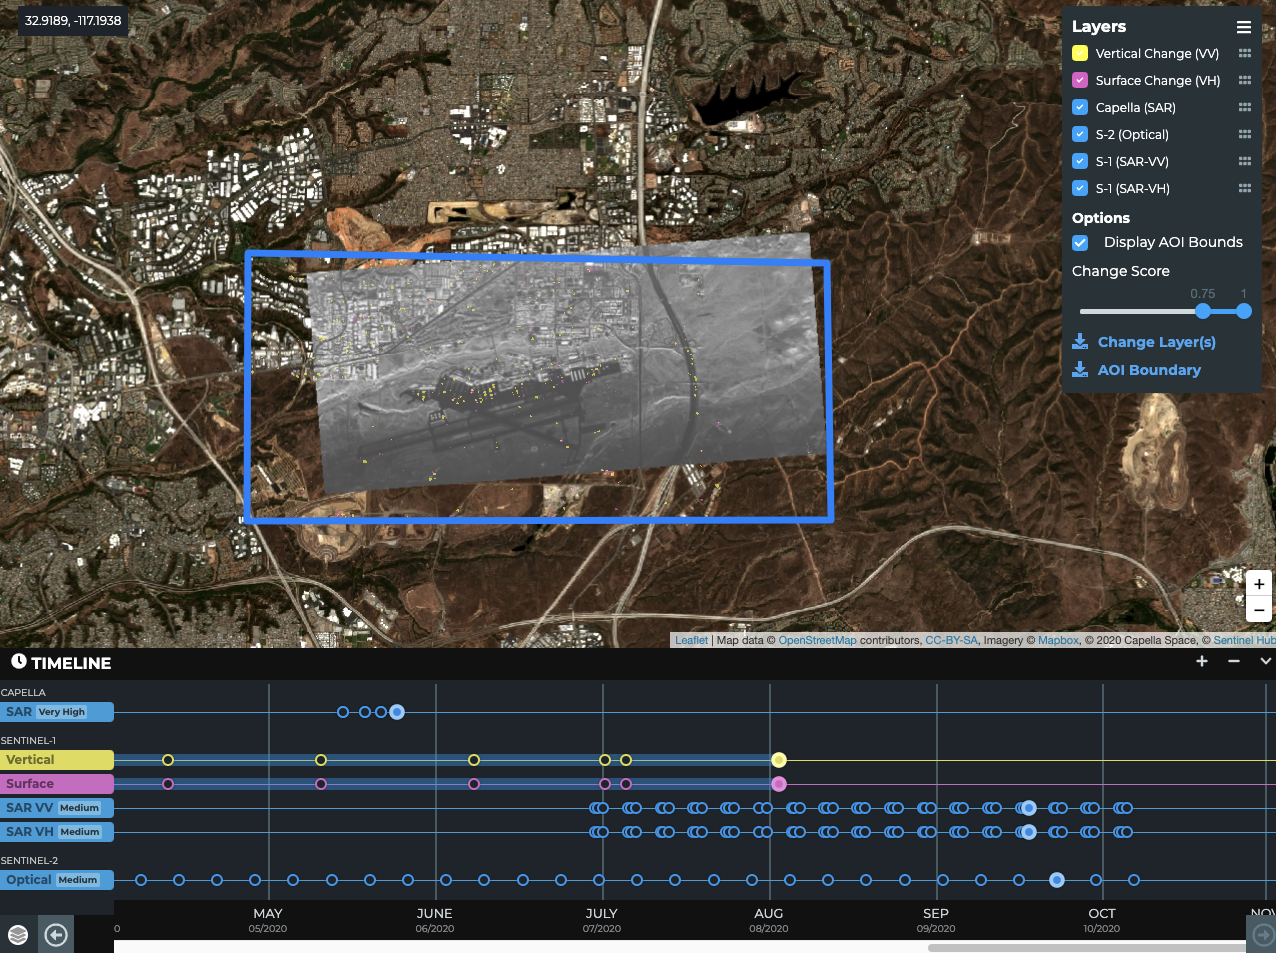
Different results for analytics are toggled on/off using the "Layers" control at the top-right of the map. For change results, the timeline is shaded (light blue) to depict the analytic range of the change results. To scroll through time, use the left and right arrows at each side of the timeline.